
Project Overview
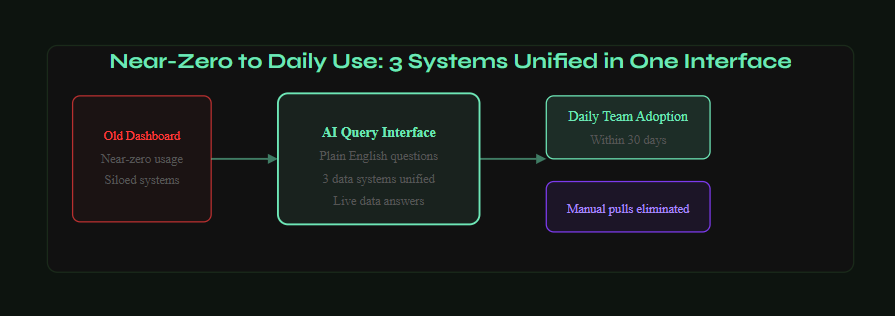
A US operations team had a reporting dashboard that had been built two years earlier and had near-zero daily usage. The team had quietly reverted to pulling data manually from their source systems because the dashboard was slow, confusing, and did not answer the questions people actually had day to day. We rebuilt it as an AI-powered interface where team members could ask operational questions in plain English and receive instant, accurate answers pulled from their live data. The rebuild also required connecting three previously siloed data systems into a unified query layer, which was the underlying technical problem the original dashboard had never solved.
The Challenge
The original dashboard had been built to display data, not to answer questions. It presented charts and tables organized around what was easy to export from each system, not around the decisions the operations team actually needed to make. The team had learned to work around it, which meant the dashboard existed as a sunk cost while the actual work of pulling and reconciling data happened manually every day.
- The dashboard had near-zero daily usage two years after launch, with the team relying entirely on manual data pulls
- Operational data lived in three different systems with no unified schema, making any cross-system question impossible to answer without manual reconciliation
- Building a reliable query layer required significant data modeling work before an AI interface could produce accurate answers
- The team had low trust in automated reporting after the failure of the first dashboard, meaning the new system had to earn adoption rather than assume it
Our Solution
We rebuilt the reporting interface as an AI-powered query layer that connected all three data systems into a unified schema and allowed team members to ask operational questions in plain English. The AI interface translated natural language questions into structured queries against the unified data layer, returning answers in context with the relevant figures and trends surfaced automatically. The design prioritized answering the questions the team actually asked, rather than displaying the data that was easiest to show.
- Unified Data Layer: We modeled a unified schema covering all three source systems, resolving field naming conflicts, standardizing metric definitions, and establishing the cross-system joins needed to answer the operational questions the team most commonly asked.
- AI Query Interface: A natural language query interface fine-tuned to the team’s operational vocabulary, translating plain English questions into structured queries against the unified layer and returning answers with relevant context and data breakdowns.
- Live Data Connection: The interface queried live data rather than a batch-updated data warehouse, ensuring answers reflected the current operational state rather than figures that were hours old.
- Question History and Saved Views: Frequently asked questions could be saved as named views, giving team members one-click access to their most common operational checks without re-typing queries.
Technical Approach
The unified data layer was built using a combination of direct API connections to the three source systems and a lightweight intermediary database that held the unified schema and handled cross-system joins. The AI query interface used an LLM-based text-to-SQL layer fine-tuned on the operational terminology and question patterns of the team, with a query validation step that checked generated SQL against the schema before execution to prevent malformed queries from reaching the database. The frontend was built in React, with a query input interface, a structured results display layer, and a saved views panel. The full stack was deployed on AWS with connection pooling and query result caching for the most common question patterns.
Results & Impact
- Dashboard adoption went from near zero to daily use by the full operations team within the first month of deployment
- All three previously siloed data systems were unified into a single queryable interface for the first time, making cross-system questions answerable in seconds rather than requiring manual reconciliation
- Manual data pulls were eliminated: the team no longer needed to export data from individual systems to answer operational questions
- Decision-making speed improved noticeably across the team, as questions that had previously required hours of manual work could be answered in real time during meetings and operational reviews
Lessons Learned
The data modeling work was the project’s most important phase and the one most likely to be underestimated. The three source systems used different naming conventions for what were effectively the same metrics, and reconciling those definitions required working through disagreements between the teams who owned each system about what the numbers actually meant. Those conversations were not technical: they were organizational. Resolving them before building the query layer was the only way to produce answers that all three teams trusted. The original dashboard had skipped that reconciliation work, which was a significant reason it had failed. The AI interface also required more careful output validation than we initially scoped. Early versions occasionally generated plausible-sounding answers from subtly incorrect SQL. Adding the query validation step and building a test suite of known-answer questions before deployment caught those issues and built the team’s confidence in the system before it went live.