
Project Overview
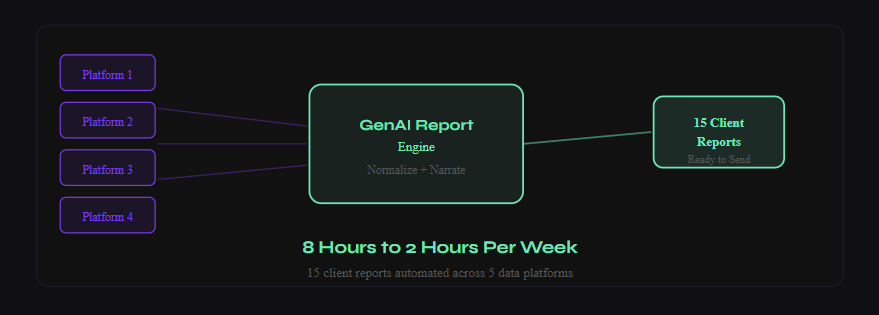
A US digital marketing agency managing 15 client accounts was producing weekly performance reports entirely by hand. Each report required pulling data from five different platforms, reconciling the numbers into a coherent narrative, and writing a client-facing summary that explained what had happened, why it mattered, and what the team recommended doing next. The process consumed a full working day every week. It was also the work the team liked least and the work clients valued most. We built a generative AI reporting tool that connected to all five data sources and produced client-ready narrative reports automatically, with a two-hour human review and send step replacing the previous eight-hour manual production process.
The Challenge
The reporting process was slow not because the team was inefficient but because the underlying problem was genuinely hard. Five platforms produced data in five different formats with five different metric naming conventions. Reconciling them into a coherent weekly picture required judgment calls that could not be reduced to a simple formula. The narrative writing on top of that reconciliation required someone who understood the client’s goals and the current campaign context.
- Data pulled manually from five platforms each week with no unified format or shared metric definitions
- Narrative summaries written entirely from scratch each week for 15 different client contexts
- Full reporting cycle consumed approximately eight hours per week of senior staff time
- Report quality and depth varied depending on who wrote it and how much time was available that week
Our Solution
We built a three-component generative reporting system. The first component handled data normalization, pulling from all five platforms and converting their outputs into a unified metric schema. The second handled narrative generation, producing client-specific performance summaries grounded in the normalized data. The third handled the review and send workflow, giving the team a structured two-hour window to check, adjust, and dispatch all 15 reports.
- Data Normalization Layer: Connectors to all five platforms pulling weekly performance data and mapping it to a unified metric schema that resolved naming conflicts and calculated the derived metrics the agency used in client reporting.
- Client Context Profiles: A structured profile for each of the 15 clients capturing their campaign goals, key metrics, preferred reporting format, and any ongoing strategic context the narrative generation layer needed to produce relevant commentary.
- Generative Narrative Engine: A generation layer that combined the normalized weekly data with the client context profile to produce a structured report draft for each account, including a performance summary, key observations, and recommended actions.
- Review Interface: A simple web interface showing all 15 report drafts with inline editing capability, allowing the team to review, adjust, and approve each report before sending.
Technical Approach
Platform connectors were built using each platform’s API with OAuth authentication, pulling the previous seven days of performance data on a scheduled Monday morning run so reports were ready for review by the time the team started work. The normalization layer ran in Python, mapping platform-specific metrics to the unified schema and computing weekly change calculations. The generation layer used the OpenAI API with a structured prompt that injected the normalized data table and the client context profile together. Average generation time per report was under 30 seconds.
Results & Impact
- Weekly reporting time reduced from eight hours to two hours of review and sending, recovering six hours of senior staff time every week
- 15 client reports produced consistently each week regardless of team bandwidth or competing priorities
- Report quality became more consistent across all 15 accounts as the generation layer applied the same level of analytical depth to every client
- The data normalization layer identified several metric discrepancies between platforms that had been producing misleading numbers in previous manual reports
- The review interface allowed the team to focus their two hours on judgment calls and client-specific context rather than on data pulling and formatting
Lessons Learned
The data normalization work was the hardest and most important part of the project. Five platforms with five metric naming conventions and five calculation methodologies meant that what looked like the same number across platforms was often measuring different things. Without resolving those discrepancies first, the generated narratives would have been built on inconsistent foundations. The normalization phase also surfaced a measurement problem the agency had not been aware of, which turned out to be one of the most valuable deliverables of the entire engagement.